Gait Analysis
Through studying gait we study the way a human walks by measuring their bodies movements, body mechanics, and activity of the muscles.
There are many things that we can learn about a person based on their gait for example we can find their height, weight, age, and leg length.
For this project our driving question was: What is the relationship between the height and gait frequency of a walking human? To determine this relationship we tested four different students and compared all data collected. We measure the distance they walked, how many steps they took, their stride length, their height, their leg length, and their shoe size. We measured their horizontal, vertical, and forward accelerations with the help of an app called Physics Toolbox Accelerometer. After downloading all data gathered by this app we graphed our data on three different graphs (gFx, gFy, and gFy) to easily notice patterns. From looking at the different graphs we were able to determine the relationship between a person's height and their gait frequency. We found that the shorter a person is the larger their gait frequency is.
|
To the left you can find our lab report in which we thoroughly explained all of our testing and findings. Below our lab report, you can find our presentation in which we explain the main aspects of this project in a simpler manner.
| ||||
|
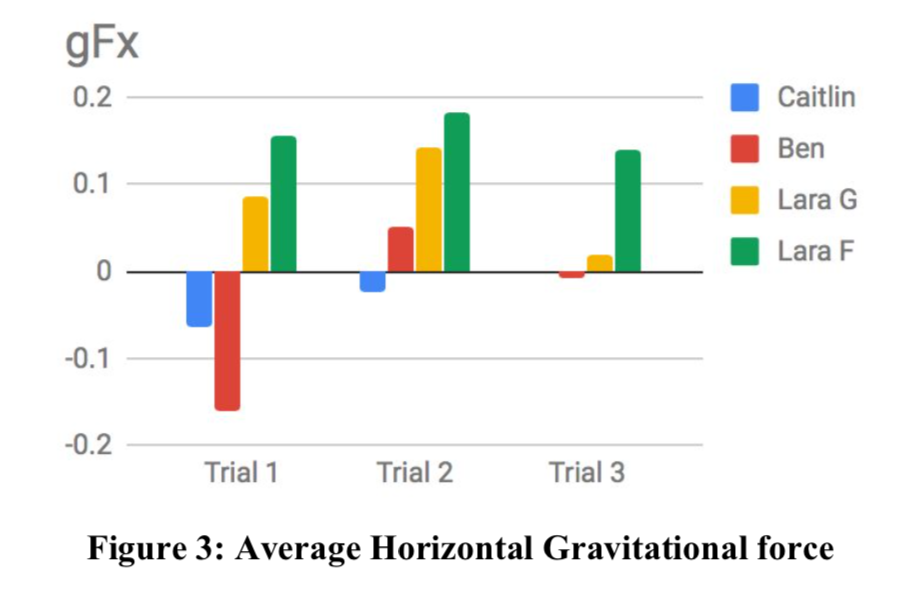
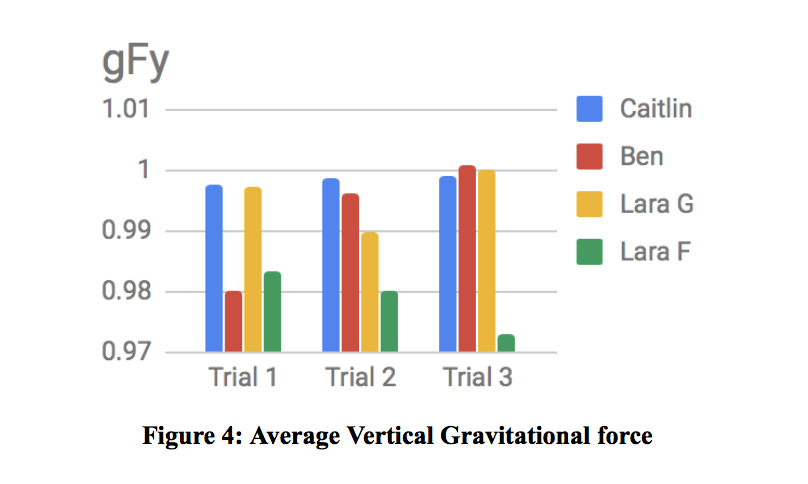
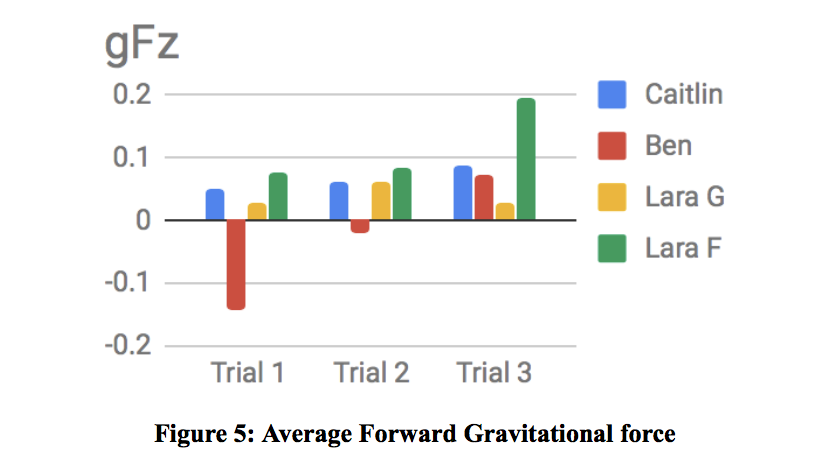
To the left you can also find our three different graphs in which gFx, gFy, and gFz are shown. Figure 3 shows gFx which is the average horizontal gravitational force. Note that there is data for Caitlin for Trial 3 however the number is too small to be displayed. Her bar has a value of 0.0016. Figure 4 shows gFy which is the average vertical gravitational force. Figure 5 shows gFz which is the average forward gravitational force.
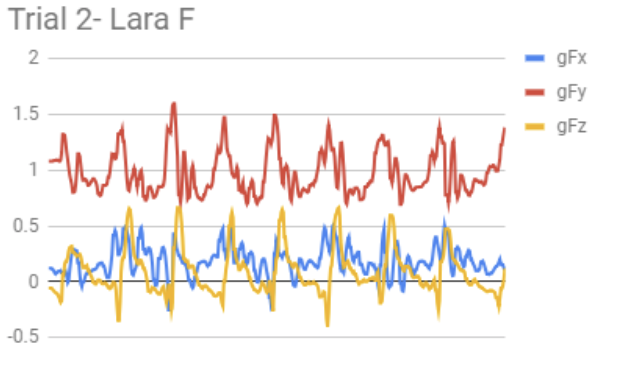
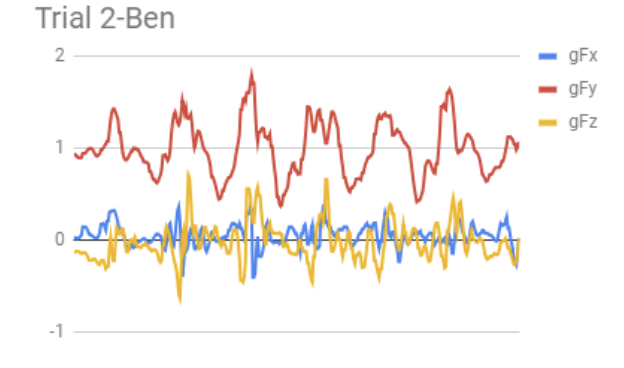
To the right you can see the graphs based on gFx, gFy, and gFz from trial two from our shortest team member (Lara F) and our tallest team member (Ben). As you can see the gait frequency is larger for Lara F than for Ben. This shows that shorter people have a larger gait frequency as they take more steps than taller people. |
|
Concepts:
Accelerometer: A device that measures the physical acceleration experienced by an object.
Dynamicity: In terms of gait analysis, the qualification of variations in kinematic or kinetic parameters within a step.
Gait: The stride of a human as he/she moves his/her limbs.
Metric: A quantitive indicator indicator of a characteristic or attribute.
Model: In technology, a description of observed or predicted behavior of some system, simplified by ignoring certain details. Models allow complex systems to be understood and their behavior predicted.
Symmetry: In terms of gait analysis, the quantification of differences between left-foot and right-foot steps.
Variability: In terms of gait analysis, the quantification of fluctuations from one stride to the next.
gFx: Average horizontal gravitational force.
gFy: Average vertical gravitational force.
gFz: Average forward gravitational force.
Reflection:
Throughout this project my group had excellent time management. At the same time as working on our gait project we were also starting another class project which meant that as a group we needed to figure out how best to spend our in class and after school time to complete all of our work. As a group we decided to quickly complete all of our testing and complete our lab report at home. This worked well as we not only completed all of our work but also completed our work a few days before the deadline which allowed us to revise it and make it our best work. Although we had great time management we could have split up the work better. We did not have a system for splitting up our work but instead just worked on whatever needed to be done. Although this was not the most organized it worked out for us.
One thing that I learned by doing this project was about the existence of an app that measures our gravitational forces at different angles. Another thing I learned is how to copy data from our app onto a google sheets. There I learned how to create different graphs by using our data. I also learned how to edit these graphs to add things such as a title, labelling the axis, and changing the colors of different parts of the graph.
One thing that I could have done better on and will continue to better is leadership. A team leader would have benefited our splitting of work. Another thing I will continue to work on is making sure that I fully understand all aspects of our projects, not just my part of it.
